Energy PilotAI

Energy analysis capacity for retrofit teams

Grow the pipeline without growing the bench.

Every opportunity you pursue costs an engineer a week. That's what caps how many you can carry — not demand. Energy Pilot takes a building from utility bills to a defensible savings number in three days, so pursuing one stops being a staffing decision.

Today 4–6
Energy Pilot 30+

Proposals per engineer, per quarter. The analysis cycle drops from eight weeks to three days.

The constraint

Your engineering capacity is the ceiling on your revenue.

Every opportunity needs a savings number a customer will believe. Producing one takes a site walk, an equipment inventory, a model, and an engineer's week. That work — not demand — is what caps how many deals you can pursue.

40–60
engineering hours to reach a defensible savings number, per building
8–12 wks
from customer interest to a proposal they'll act on
50%+
of qualified opportunities that never reach a proposal at all

What the bottleneck costs

Same bench. More pipeline.

Today
Engineering hours per proposal40–60
Time to a credible savings number8–12 wks
Proposals per engineer, per quarter4–6
Site walk → structured equipment list3–5 days
Pre-sale cost per opportunity$15–25K
Deals under $200KNot worth pursuing
With Energy Pilot AI
Engineering hours per proposalUnder 5
Time to a credible savings number3 days
Proposals per engineer, per quarter30+
Site walk → structured equipment listSame visit
Pre-sale cost per opportunity< $500
Deals under $200KNow worth pursuing

Illustrative figures based on industry benchmarks and pilot data.

One building, from bills to signed-ready.

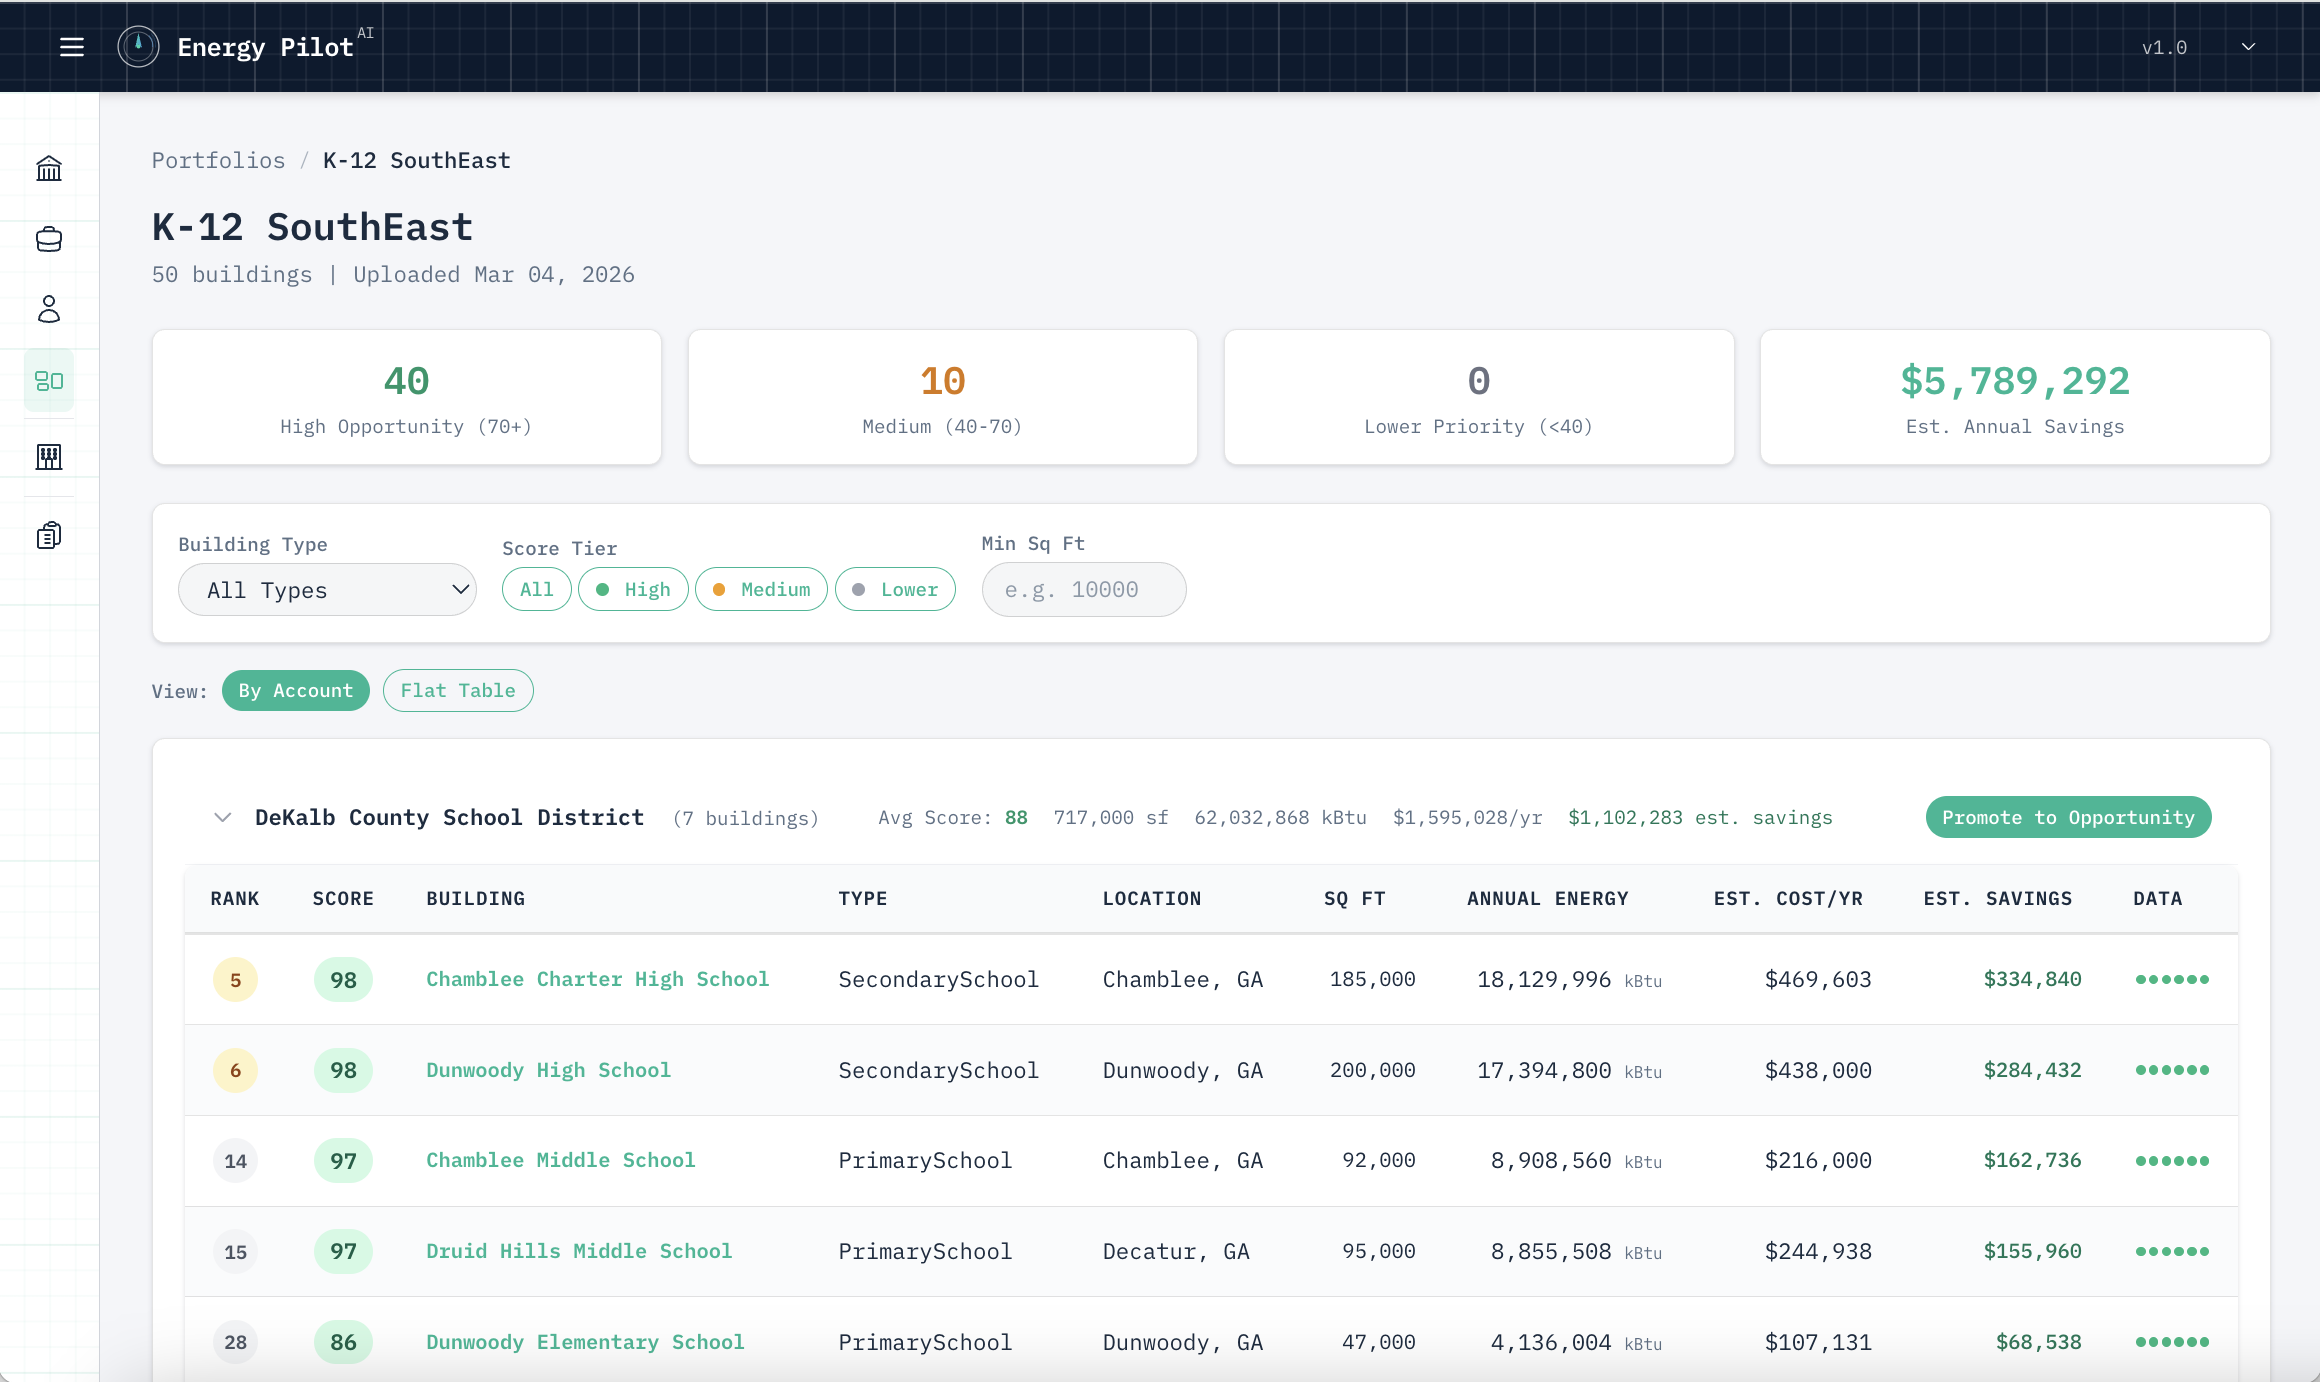
  1. A folder of utility bills becomes twelve months of parsed meter dataImport wizard · PDF, Excel, CSV, photos of bills
  2. Benchmark and bill analysis reports go back to the customerDeliverable · the artifact that earns the site visit
  3. A capture walk photographs nameplates; specs fill themselves inEquipment · make, model, serial, capacity, age
  4. BAS and telemetry connect; scheduling and control faults surfaceTelemetry · Load Analysis
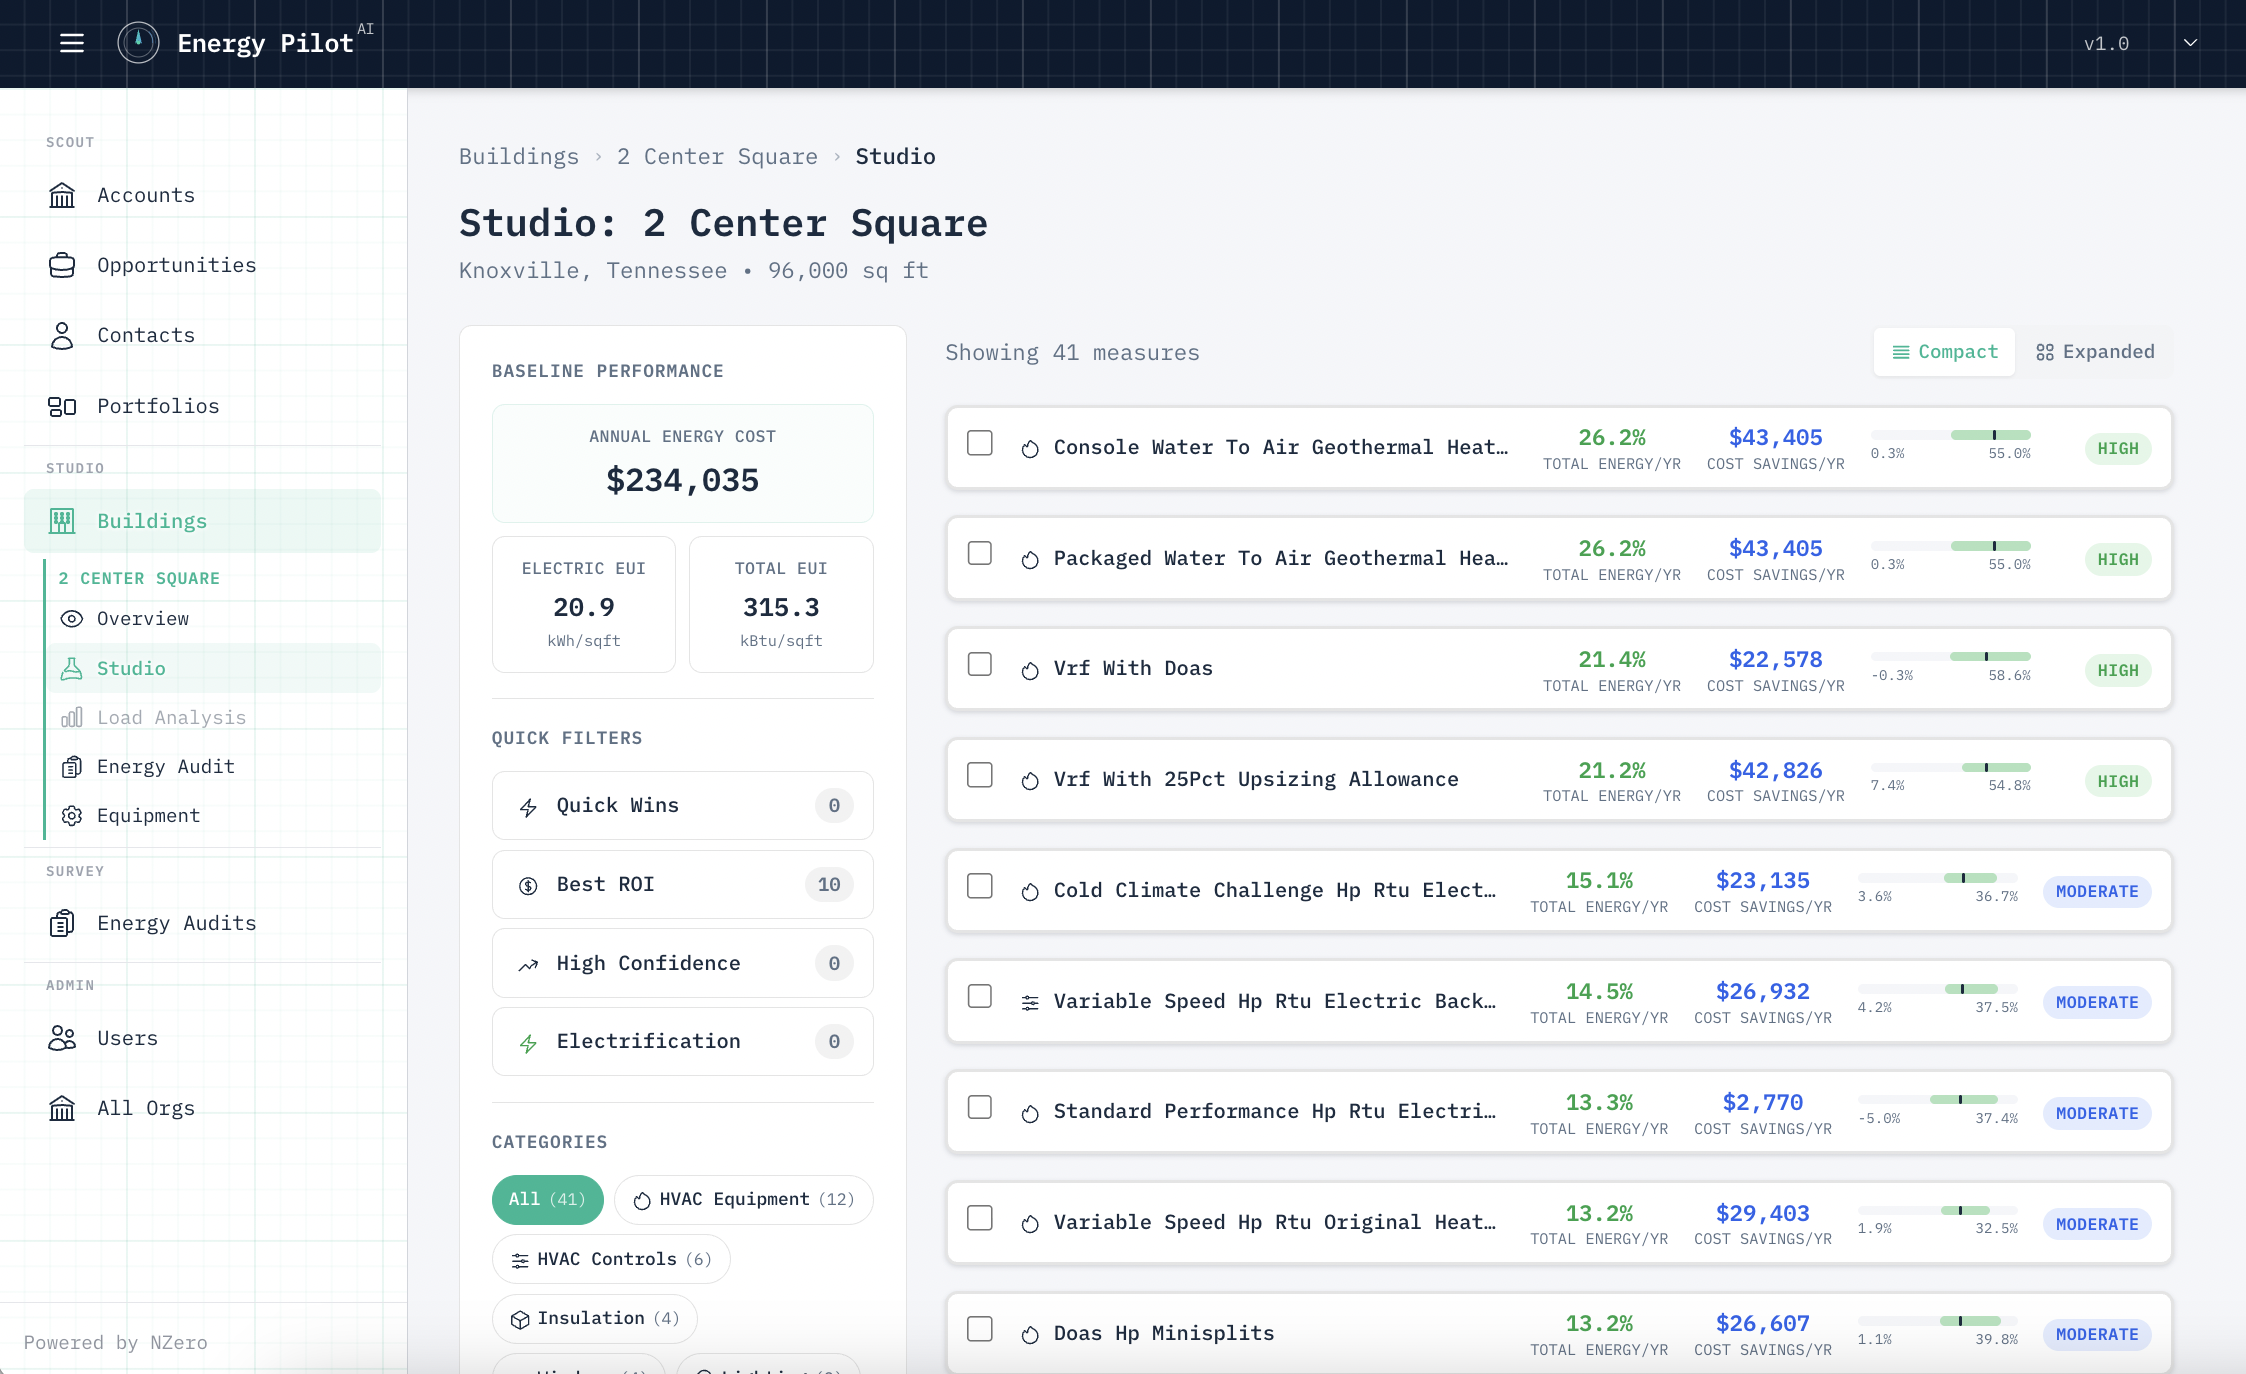
  5. Measures are ranked with savings, capital, payback and confidenceLab · 61 ECMs, equipment-specific calculations
  6. A scenario becomes a branded proposal on your letterheadScenario → Case → Deliverable

Eight weeks of analysis. Three days of work. No engineer rebuilt anything twice.

The platform

One building record. Everything runs off it.

There are no separate modules to buy or stitch together. Data lands once on the building and every downstream number — benchmark, forecast, engineering calculation, proposal, verified savings — reads from the same record.

01 / Data

Bills & meters

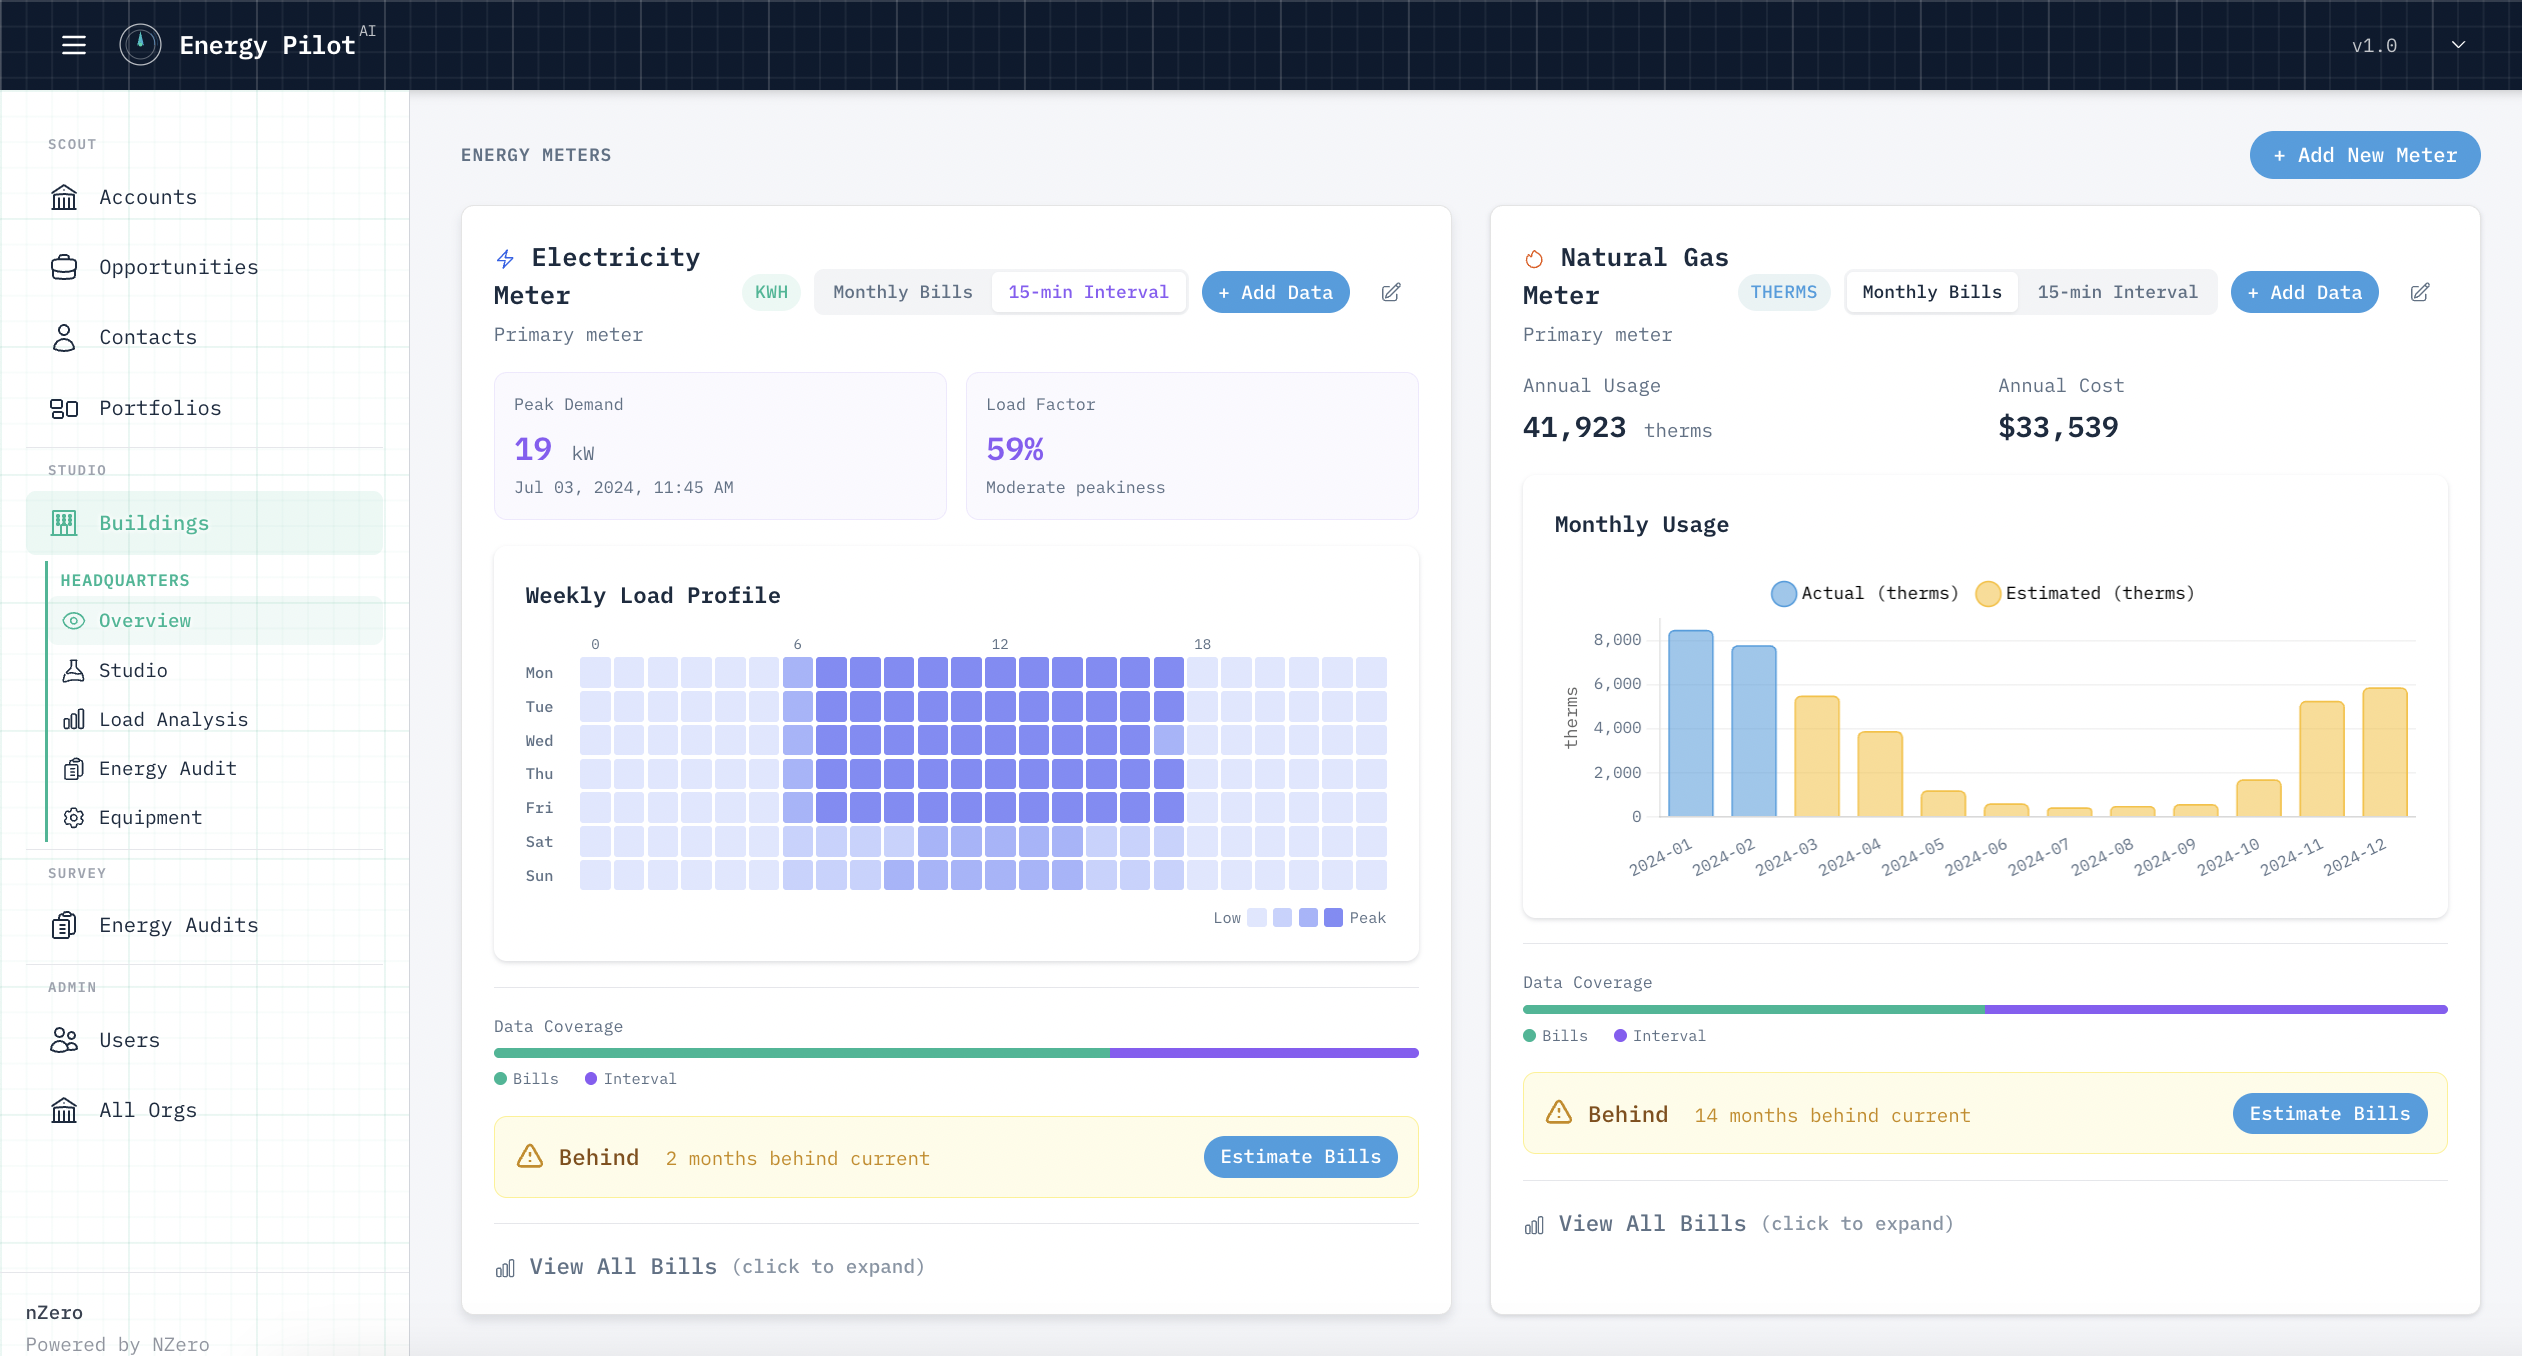
Drop in whatever the utility sends. Bills parse into structured meters, and the Estimate wizard models the months your folder is missing — labelled as estimates, never quietly filled.

Overview · Data

02 / Assets

Equipment

Photograph a nameplate on a capture walk. Make, model and serial are read on the spot, then matched against our equipment database to fill in the specs an engineer would otherwise chase.

Equipment

03 / Signal

Telemetry

Connect BAS, BMS and equipment telemetry. Load Analysis reads real operating patterns and surfaces scheduling and control faults before anyone commits to a measure.

Telemetry · Load Analysis

04 / Output

Lab → Case

Rank measures by savings, capital, payback and confidence. Bundle the ones you like into a scenario, attach it to a Case, and generate the customer-ready document.

Lab · Cases · Deliverables

Energy Pilot's Lab measure list: each measure shows energy, annual savings, capital, payback and a four-level confidence rating, with the 80% range printed directly beneath every value and payback given as an interval rather than a point estimate.

Depth on demand

Buy the certainty the deal actually requires.

A screening number and a contract-grade number are the same building record at different depths. Add data, the range narrows, the number gets more defensible — and nothing gets rebuilt when the deal gets serious.

01 · Engage

Open the conversation

Utility bills in, benchmark and bill analysis reports out. A credible artifact to put in front of a customer before anyone visits the site.

Meter · platform fee

02 · Assess

Capture the building

Capture walk, equipment inventory, telemetry connection. The site visit produces structured data instead of a notebook.

Meter · per building assessed

03 · Engineer

Reach a defensible number

Equipment-specific engineering calculations and auto-calibrated building energy models, with confidence ranges on every measure.

Meter · per building engineered

04 · Verify

Prove it after the sale

The calibrated baseline that won the deal keeps running. Realized savings tracked against it, IPMVP-aligned, with drift flagged early.

Meter · per building / year

Wide range · address & square footage Narrow range · calibrated & metered

The asset layer

Numbers an engineer will sign off on start with real equipment.

Most tools estimate from building type and square footage. Energy Pilot calculates from what is actually installed — captured on the walk, enriched from our equipment database, confirmed against telemetry. That is the difference between a plausible number and a defensible one.

Capture walkPhotograph a nameplate on a phone. Make, model, serial and capacity are read on the spot, no transcription afterward.
Proprietary equipment databaseMatched units come back with full specifications — efficiency, capacity, refrigerant, controls — filled in automatically.
BAS & telemetry ingestionOperating schedules, setpoints and runtime from the building's own systems, not assumptions about how it is run.
Equipment ECMsMeasures calculated against the specific unit being replaced, with the replacement's specifications — not a category average.

Built around your methods

Your calculations. Our speed.

Your engineers have spent years building savings calculations they trust and are willing to defend to a customer. We are not asking you to give those up. We are removing the spreadsheet labor around them.

Your ECM library, loaded inBring your own measures, assumptions and calculation methods. They run inside the Lab alongside ours, against real equipment data.
Your calculation logic, preservedExisting spreadsheets become repeatable, auditable calculations that every engineer on your team runs the same way.
Your documents, your voiceCustom report and proposal templates matching what your customers already receive from you.
Typically live in daysNot a services engagement. Most custom calculation and report work is configured and running inside the first pilot.

Under the hood

Fast enough to screen. Rigorous enough to sign.

Three calculation methods behind one interface. Energy Pilot picks the right fidelity for what the deal needs and what data exists — and tells you how confident it is either way.

Method 01
ML range forecasts

Quantile regression trained on 10M+ calibrated simulations. Savings ranges from as little as an address, square footage and annual energy.

Method 02
Equipment engineering

Engineering calculations run against captured nameplate specifications and the specifications of the replacement unit.

Method 03
Calibrated energy models

Auto-constructed building energy models, calibrated against utility data at the click of a button. Export the model file for offline analysis.

Confidence
On every number

Each measure carries an 80% confidence range that narrows as data improves. No measure is presented as more certain than it is.

Coverage
61 ECMs

HVAC equipment and controls, lighting, envelope, renewables, storage, demand flexibility — plus whatever you bring.

Validation
CVRMSE under 15%

Median error against calibrated simulations, inside ASHRAE Guideline 14 tolerances for monthly calibration.

After the sale

The model that won the deal is the model that measures it.

Measurement and verification is usually a second project — new baseline, new data collection, new spreadsheet. It doesn't have to be. The calibrated baseline you already built keeps running against incoming meter and sub-meter data.

Continuous comparisonRealized consumption tracked against the calibrated baseline the proposal was written from.
IPMVP-aligned reportingOption B and Option C protocols, with reporting periods and adjustments handled in the platform.
Early warning on guaranteesDrift against guaranteed savings surfaces while there is still time to act on it.
Portfolio rollupsRealized savings, remaining opportunity and next best action across every building you've touched.
Energy Pilot's measurement and verification chart: the model's adjusted baseline plotted against actual metered use across twelve months, with the gap between them shaded as verified avoided energy and the M&V savings target drawn alongside.

Built for

Three businesses. Three different bottlenecks.

ESCOs & energy services You have more opportunities than engineering hours. Cut the analysis cycle from weeks to days, run your own ECM library inside the platform, and carry the same calibrated model straight into M&V. See the ESCO workflow →
HVAC OEMs & channel Your constraint is reach, not depth. Prioritize portfolios by replacement opportunity, put equipment-specific numbers in a dealer's first meeting, and upgrade an entire channel's sales motion in one deployment. Talk to us about channel →
A&E & engineering firms Screening work doesn't bill well and doesn't convert. Let the platform take the preliminary analysis to a defensible number, and hand your engineers the calibrated model with nothing to rebuild. See the engineering workflow →

Getting started

Analyzing real buildings inside two weeks.

Days 1–2

Discovery

A thirty-minute call on how your team currently gets to a savings number, which measures you sell, and where the weeks actually go. Send a building and we'll come back with it analyzed.

Days 3–5

Configuration

Your instance, your branding, your ECM library and calculation methods, your report templates. This is where your existing engineering work gets loaded in.

Week 2

Live

Your engineers and sales team work real opportunities in the platform. We iterate on feedback in two to three day cycles through the first month.

The offer

Send us one building. We'll send back the analysis.

An address, a square footage, and whatever utility bills you have. You get back a benchmark, a ranked measure list with confidence ranges, and a sample proposal — inside one business day. The same work that currently takes your team a month.

Or reach us directly: sales@energy-pilot.ai

No commitment. We'll reply within one business day.